DIY Indoor Air Quality Monitor
I had never given much thought to the quality of indoor air until recently. My first experience with indoor air monitoring was through the Amazon Smart Air Quality Monitor, which was quite disappointing. Despite its shortcomings, it was still useful in introducing me to the concept and encouraging me to explore the topic further.
The information provided by air quality monitors is valuable because poor indoor air quality can contribute to health issues and reduced productivity. For me personally, the measurement of carbon dioxide levels has been the most important factor. Unfortunately, the Amazon monitor did not include this measurement. I have noticed that CO₂ levels increase noticeably when I feel anxious or when I exercise, which serves as a useful indicator that additional ventilation may be needed.
The Problem
Firstly, why did I decide to build an indoor air quality monitor in the first place? Are there no existing solutions on the market? The answer is simple: I did it for the fun of it.
More generally, the solutions currently available are often not as convenient or customizable as I would like. I also dislike the poorly designed companion apps that have become common with modern products. I do not want yet another bloated app—one that somehow combines social media, an online store, and countless other features—that requires me to give up my privacy just to use a simple device.
Finally, I have always been fascinated by understanding how things work (as evidenced by the number of things I broke during my childhood while trying to find out). Through this project, I have learned many interesting things and gained a deeper appreciation for the process of building and experimenting. It reminds me of a quote from Prelude to Foundation by Isaac Asimov:
The sky was almost cloudless, but it was a pale blue, as though wrapped in a high thin mist. That, thought Seldon, was a good touch, but suddenly he missed the sun itself. No one on Trantor saw the planet’s sun unless he or she went Upperside and even then only when the natural cloud layer broke.
Did native Trantorians miss the sun? Did they give it any thought? When one of them visited another world where a natural sun was in view, did he or she stare, half-blinded, at it with awe?
Why, he wondered, did so many people spend their lives not trying to find answers to questions–not even thinking of questions to begin with? Was there anything more exciting in life than seeking asnwers?
The Solution
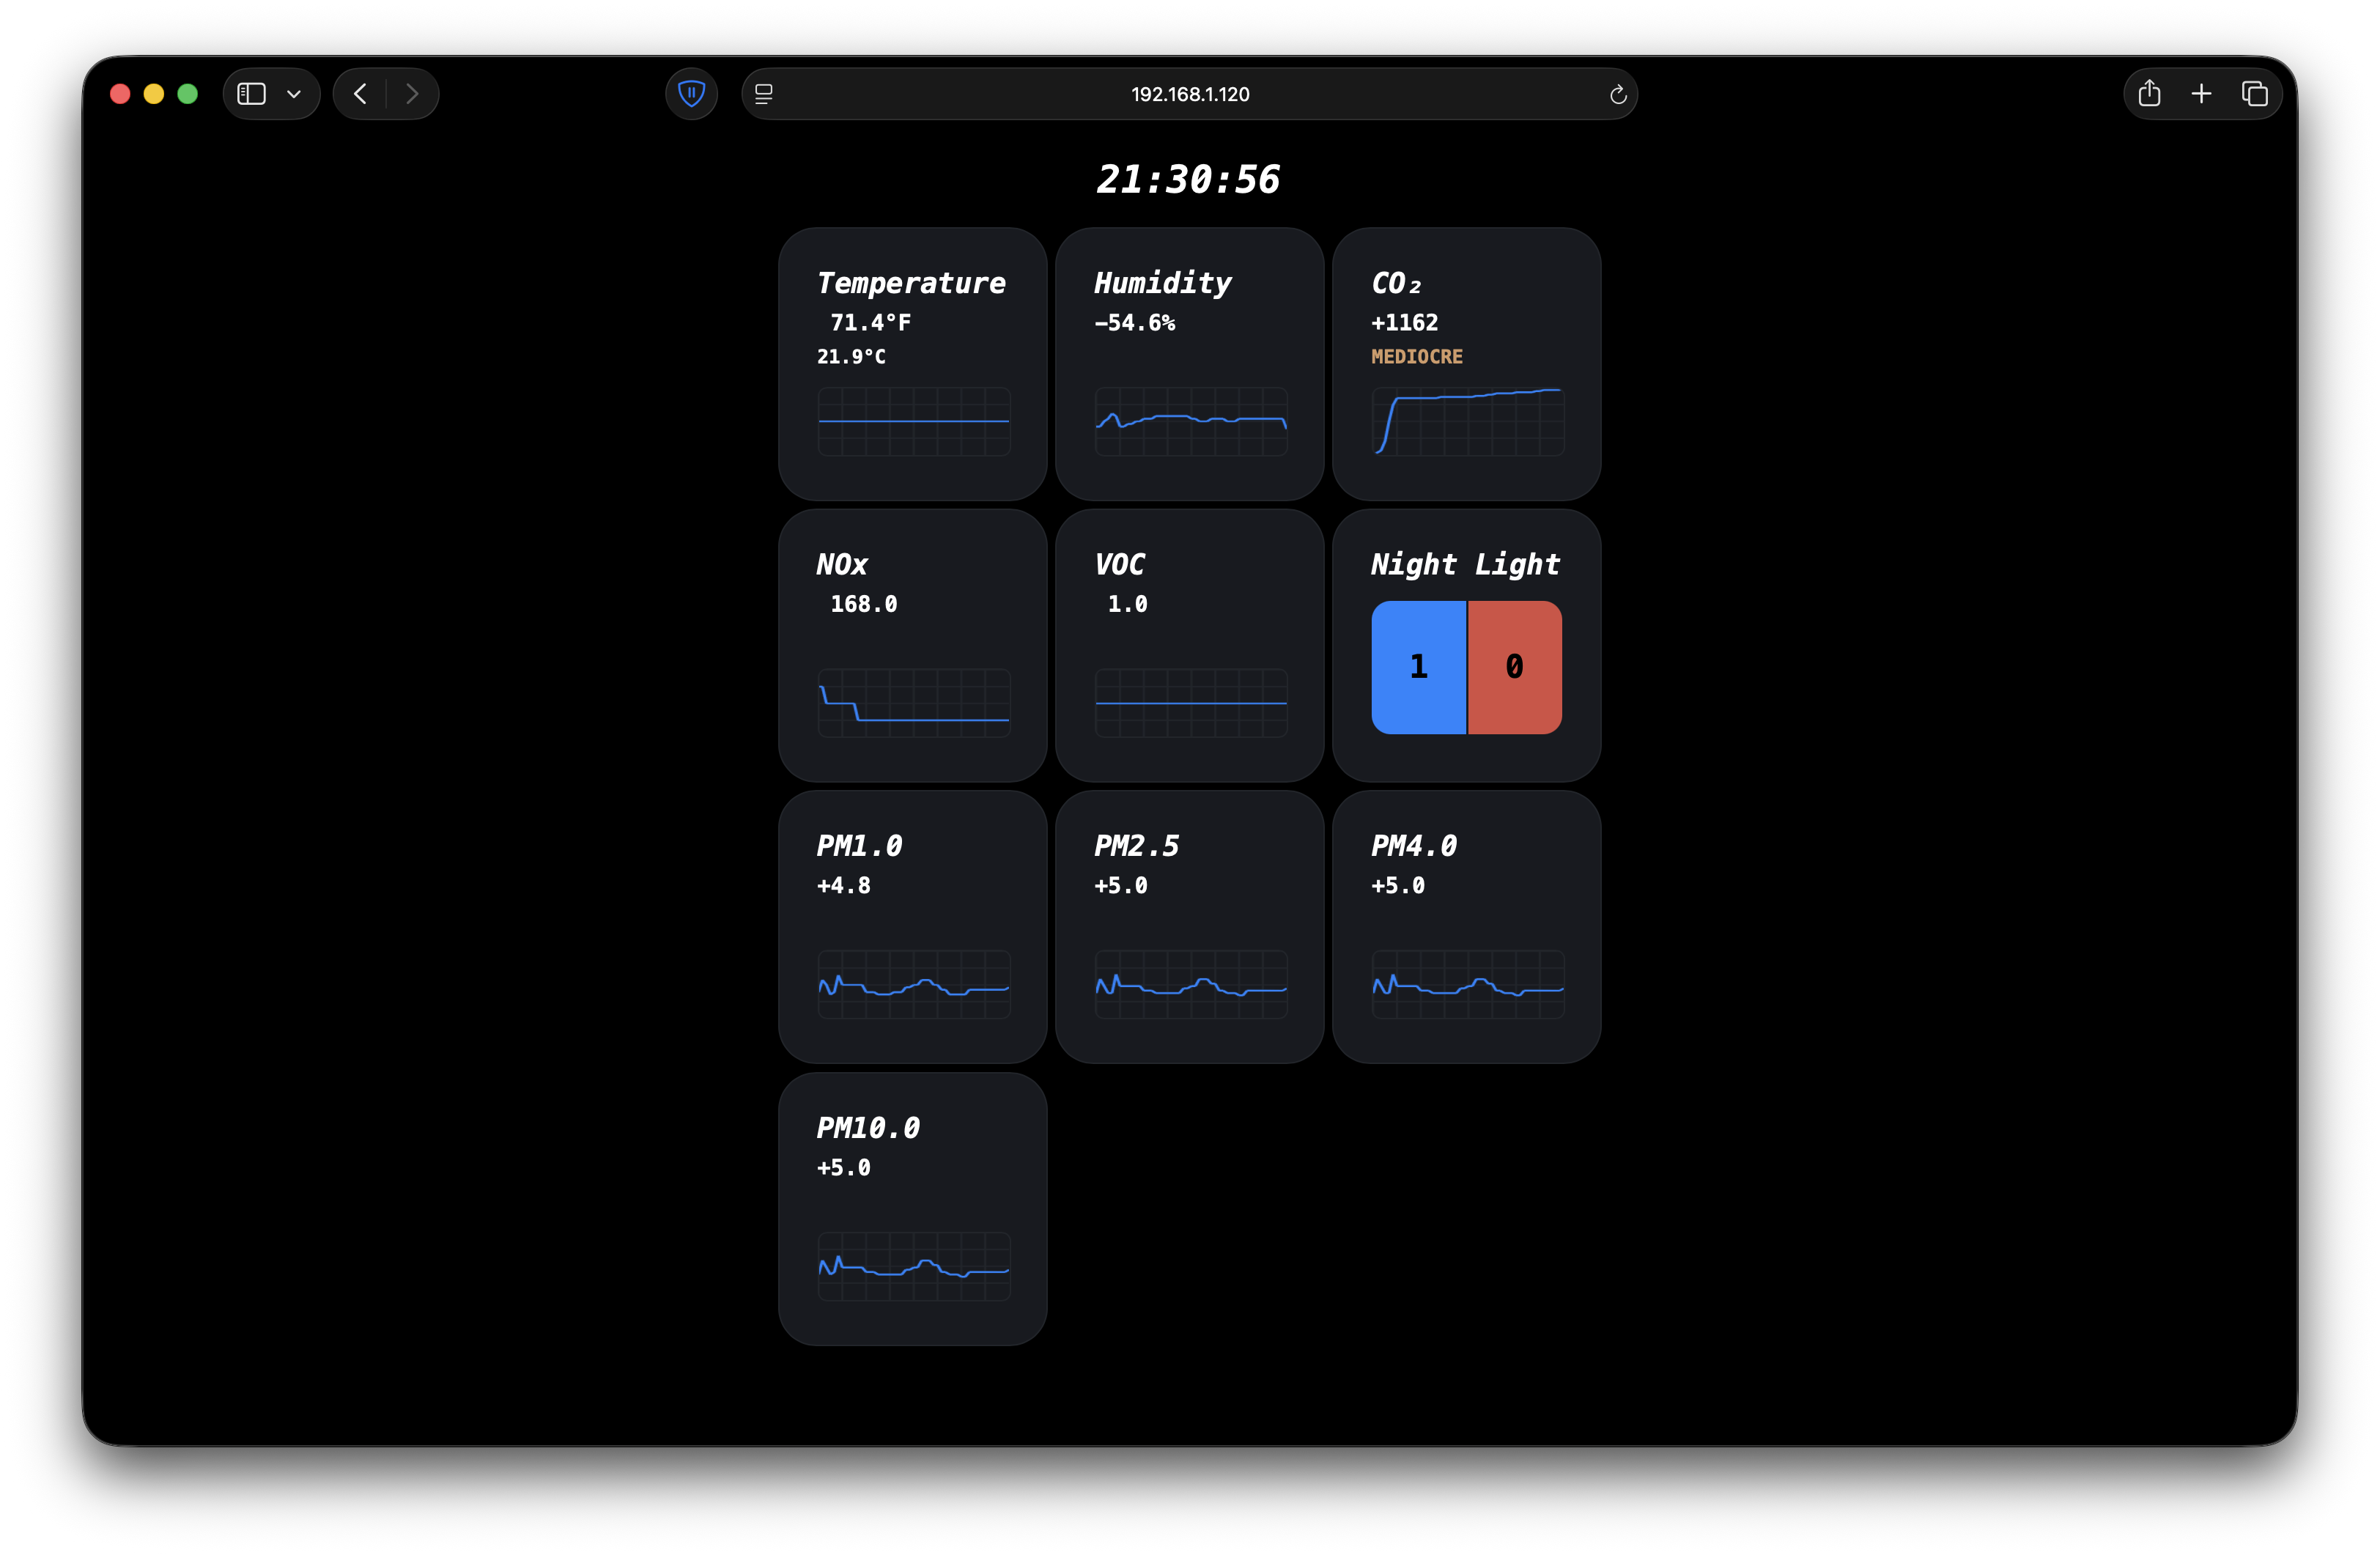
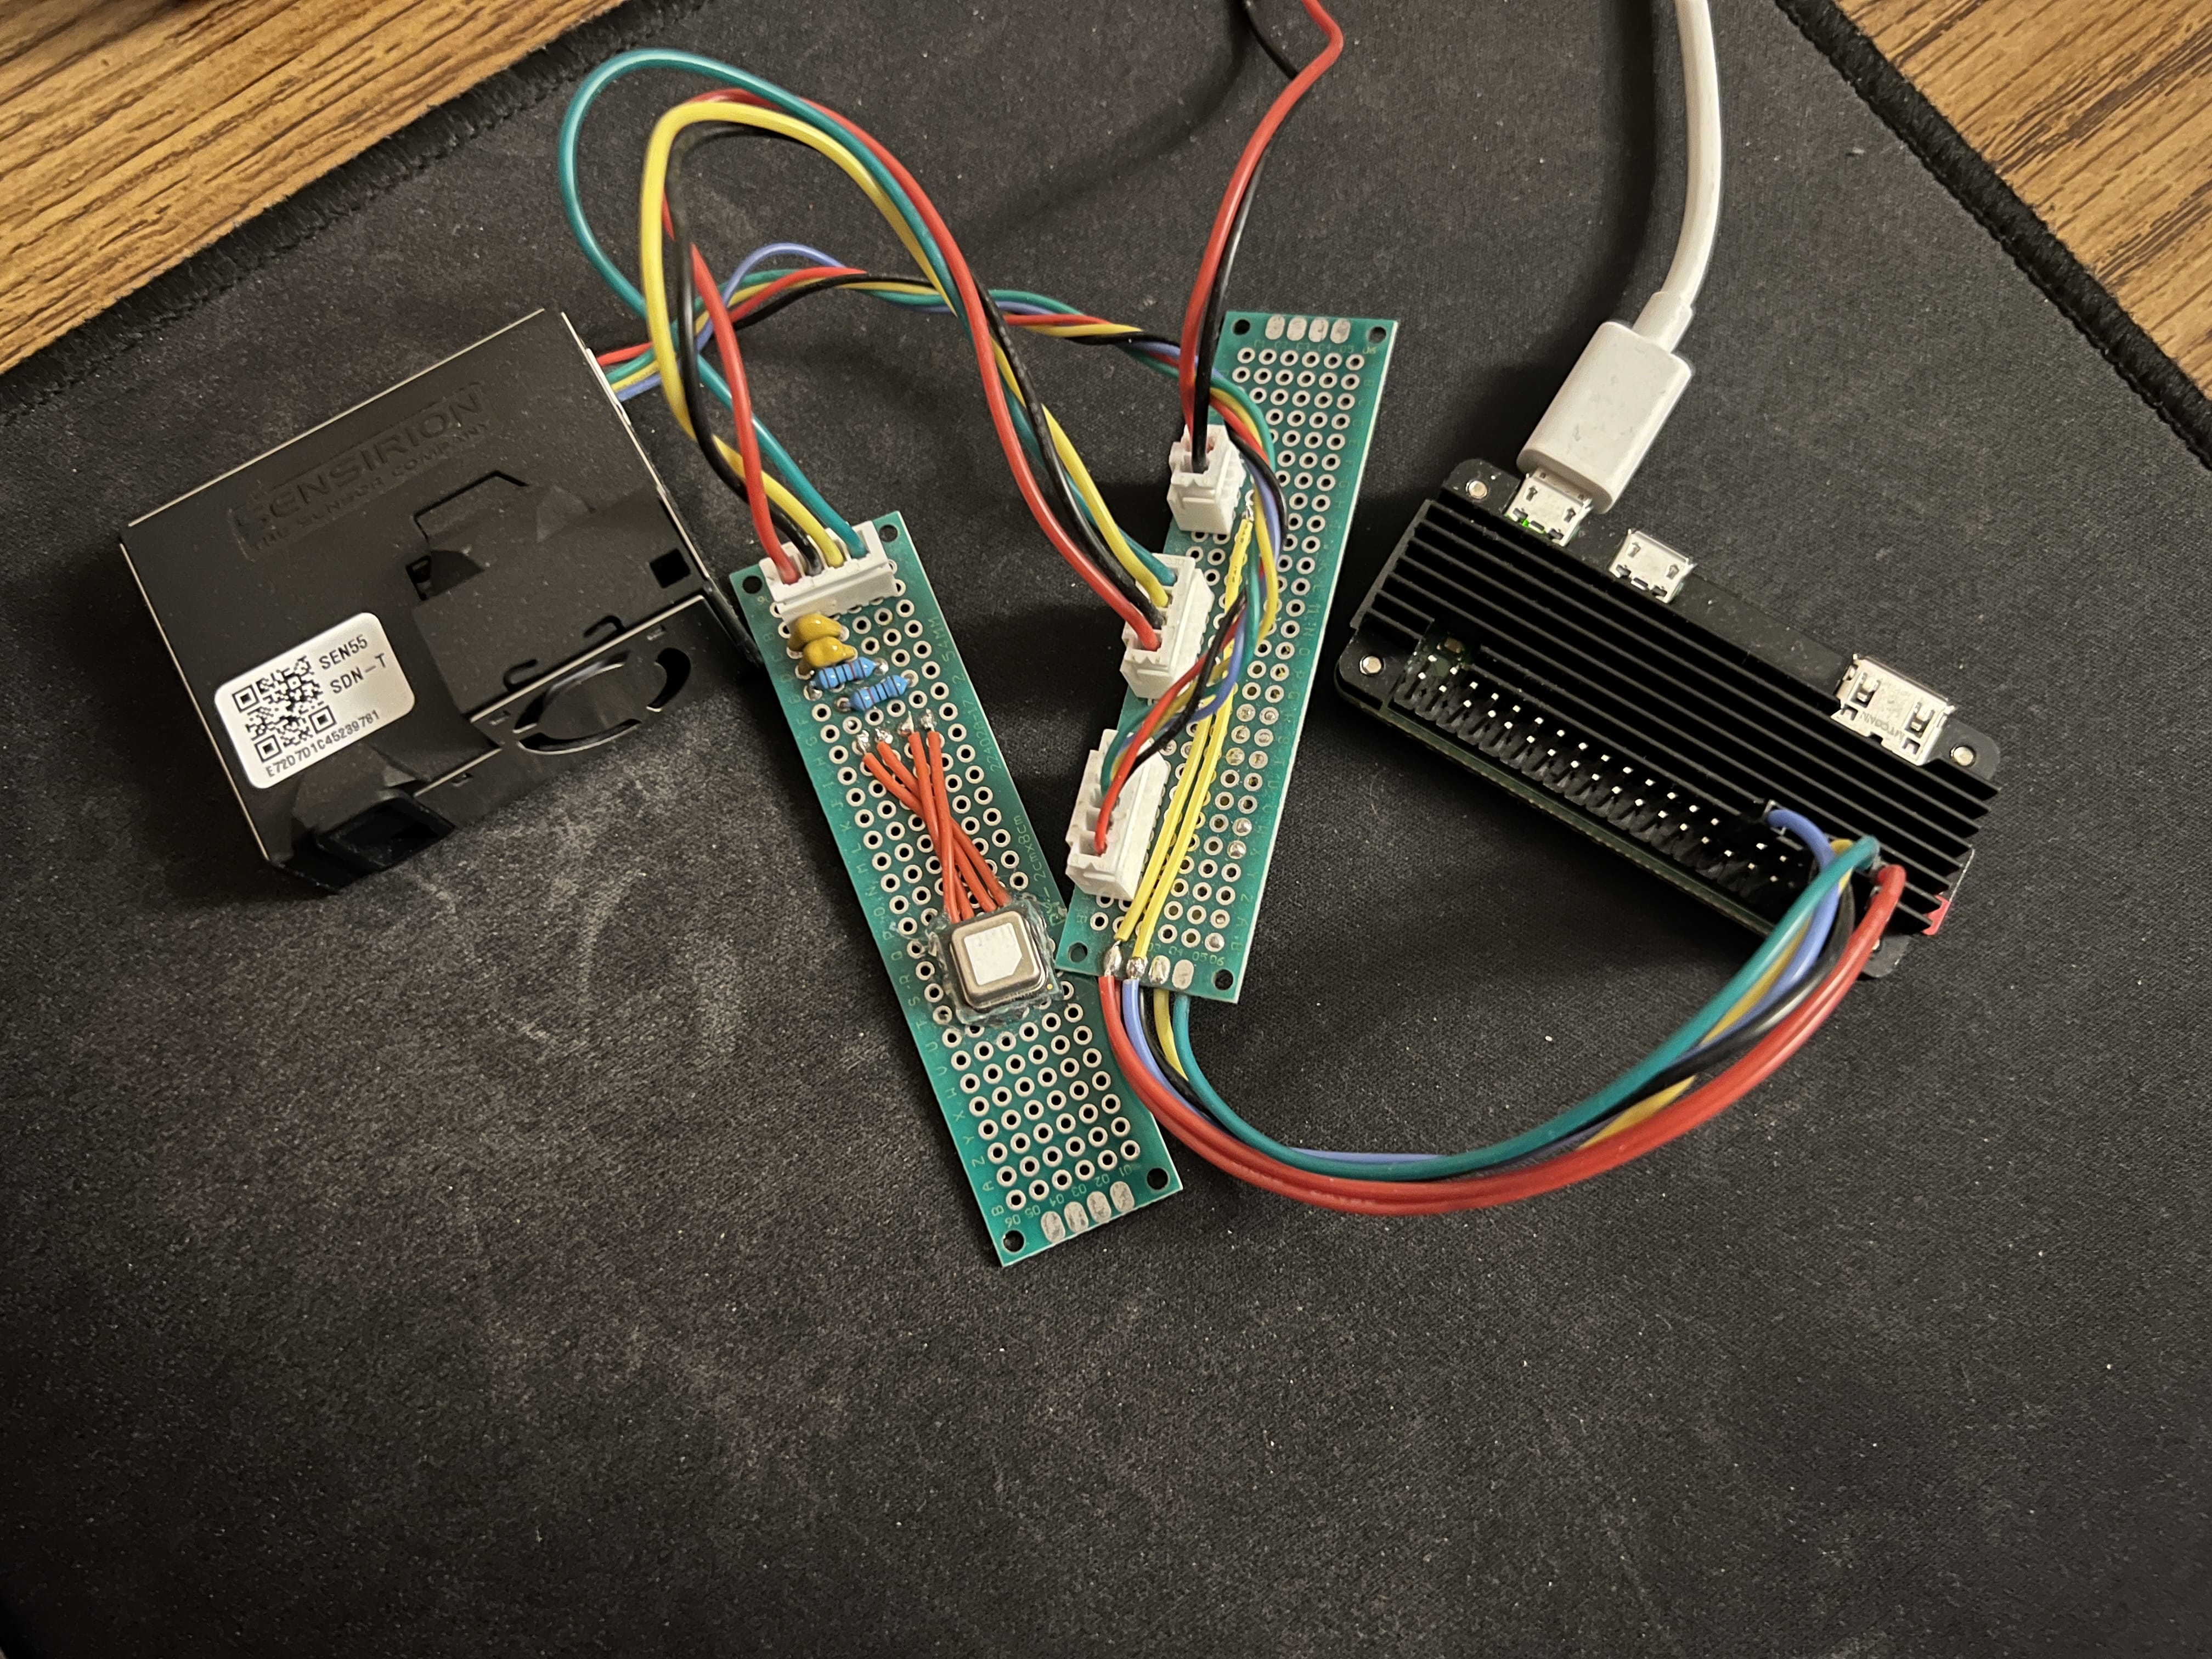
Implementation
To begin with, I used a Raspberry Pi Zero 2 W for this project. It is capable of running a full Linux operating system and includes built-in Wi-Fi, which makes it a great platform for this application. Running an entire OS simplifies many aspects of development and saves significant implementation time. For example, instead of writing my own web server, I can use existing software such as nginx to serve static pages and provide an API.
That being said, I will most likely write my own server in C using UNIX sockets in the future to make the project more portable. While nginx is powerful, its setup can be unnecessarily complicated; having a lightweight server that can simply be compiled and executed would make deployment much easier.
The earliest versions of this project used an Arduino Nano, a display, and buttons to cycle through different parameters. However, as shown in the pictures, transferring the information to other devices provides a much more convenient and flexible user experience.
Overall Architecture
Daemon
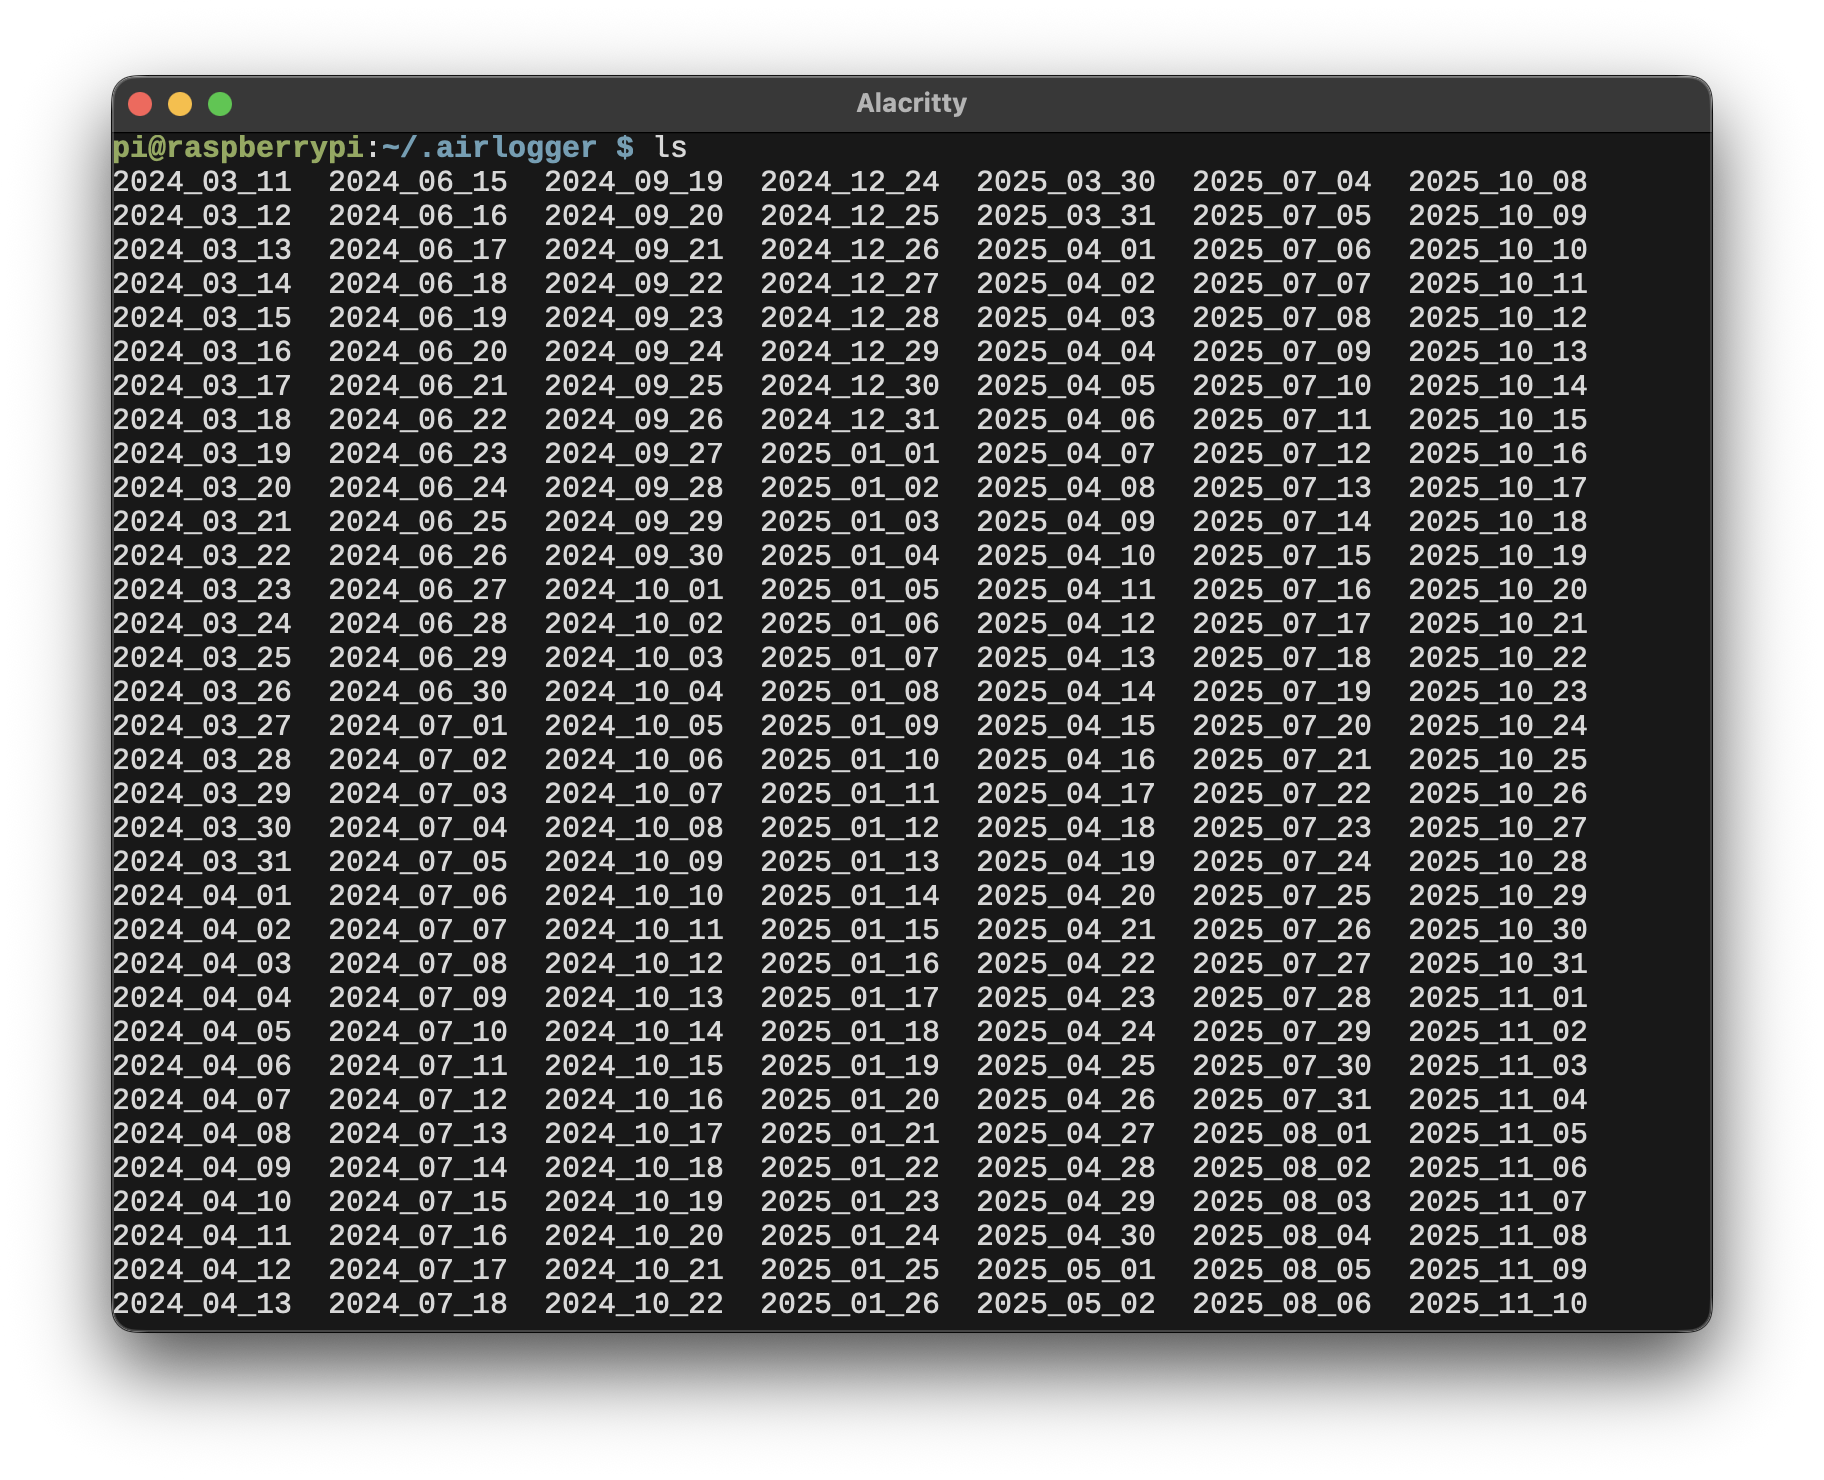
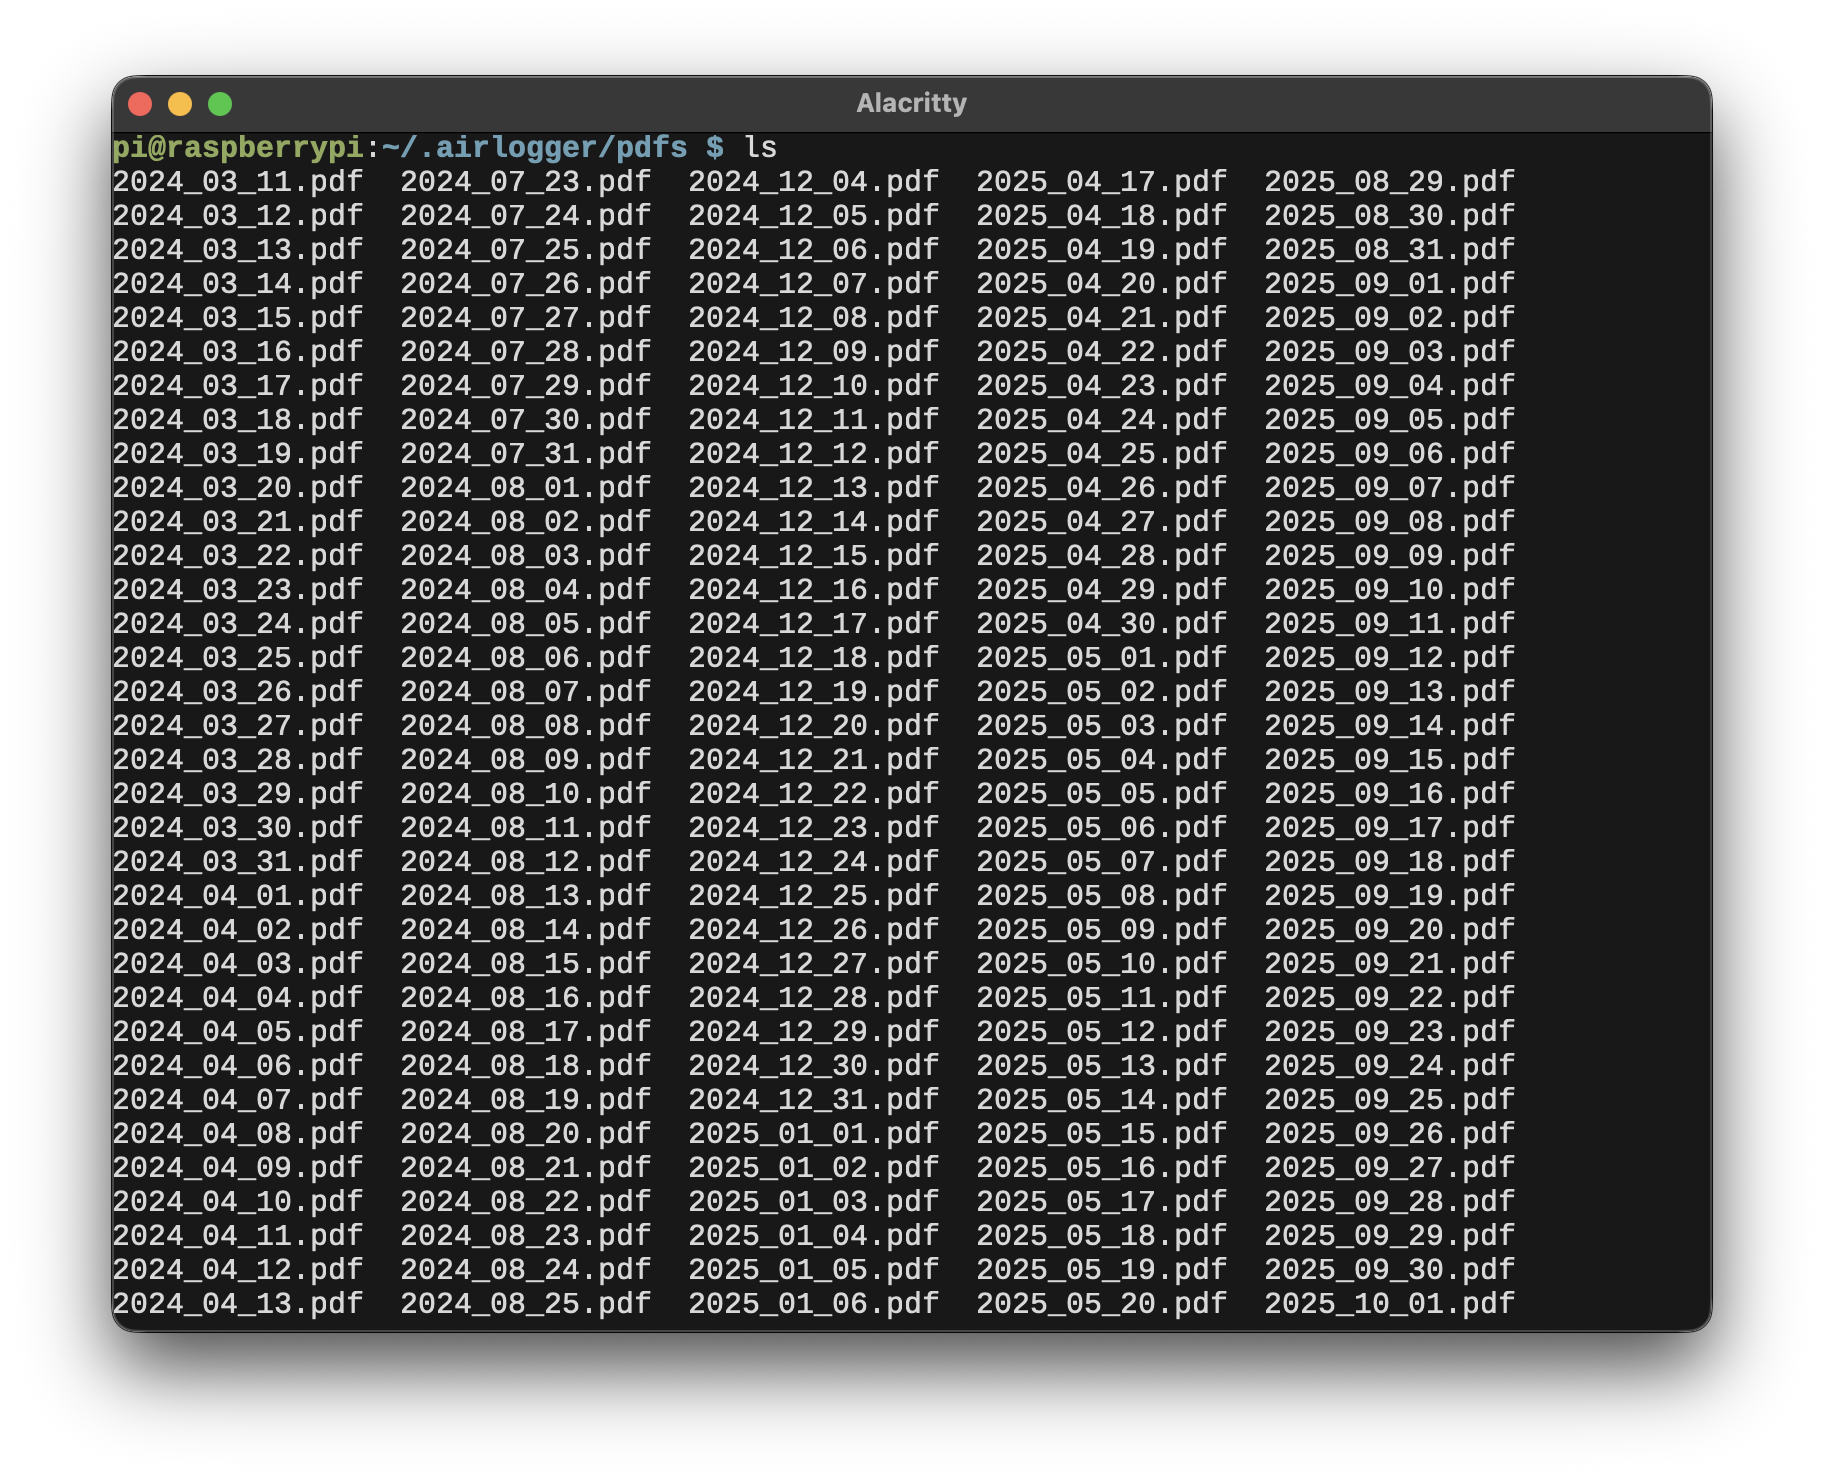
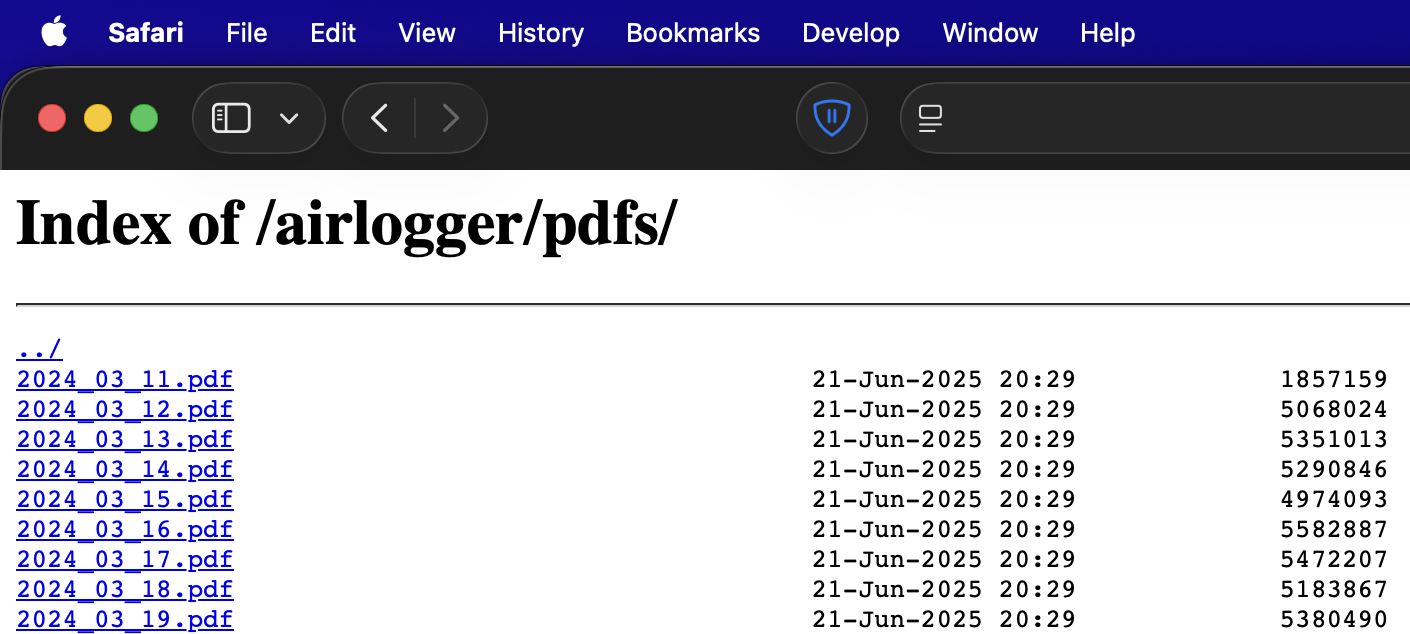
I wrote a daemon that communicates with the sensors and records their measurements to a file every five seconds. To maximize portability, the data is stored as plain text, with values separated by spaces and newlines. Unlike binary formats, plain text can be read and analyzed by virtually any software without requiring specialized tools or libraries. After 24 hours of continuous recording, the resulting file is approximately 1 MB in size.
At midnight, after the daemon finishes writing the current day’s log and begins a new one, a cron job executes another program that retrieves weather data from Open-Meteo using curl, parses the returned JSON, and generates a PDF chart. As a result, each daily report includes both the indoor measurements and the corresponding outdoor weather conditions, allowing for easy comparison of indoor temperature and humidity with the local environment.
Front-end
The front end was developed using HTML, JavaScript, and Tailwind CSS. The
JavaScript code polls the server’s API every two seconds to retrieve the latest
sensor readings and updates the displayed values accordingly. It is also
responsible for rendering the simple trend charts by drawing directly onto an
HTML <canvas> element.
Although numerous JavaScript charting libraries are available, I chose to implement the charts myself. This approach kept the application lightweight, eliminated unnecessary dependencies, and provided complete control over the appearance and behavior of the visualizations.
Back-end
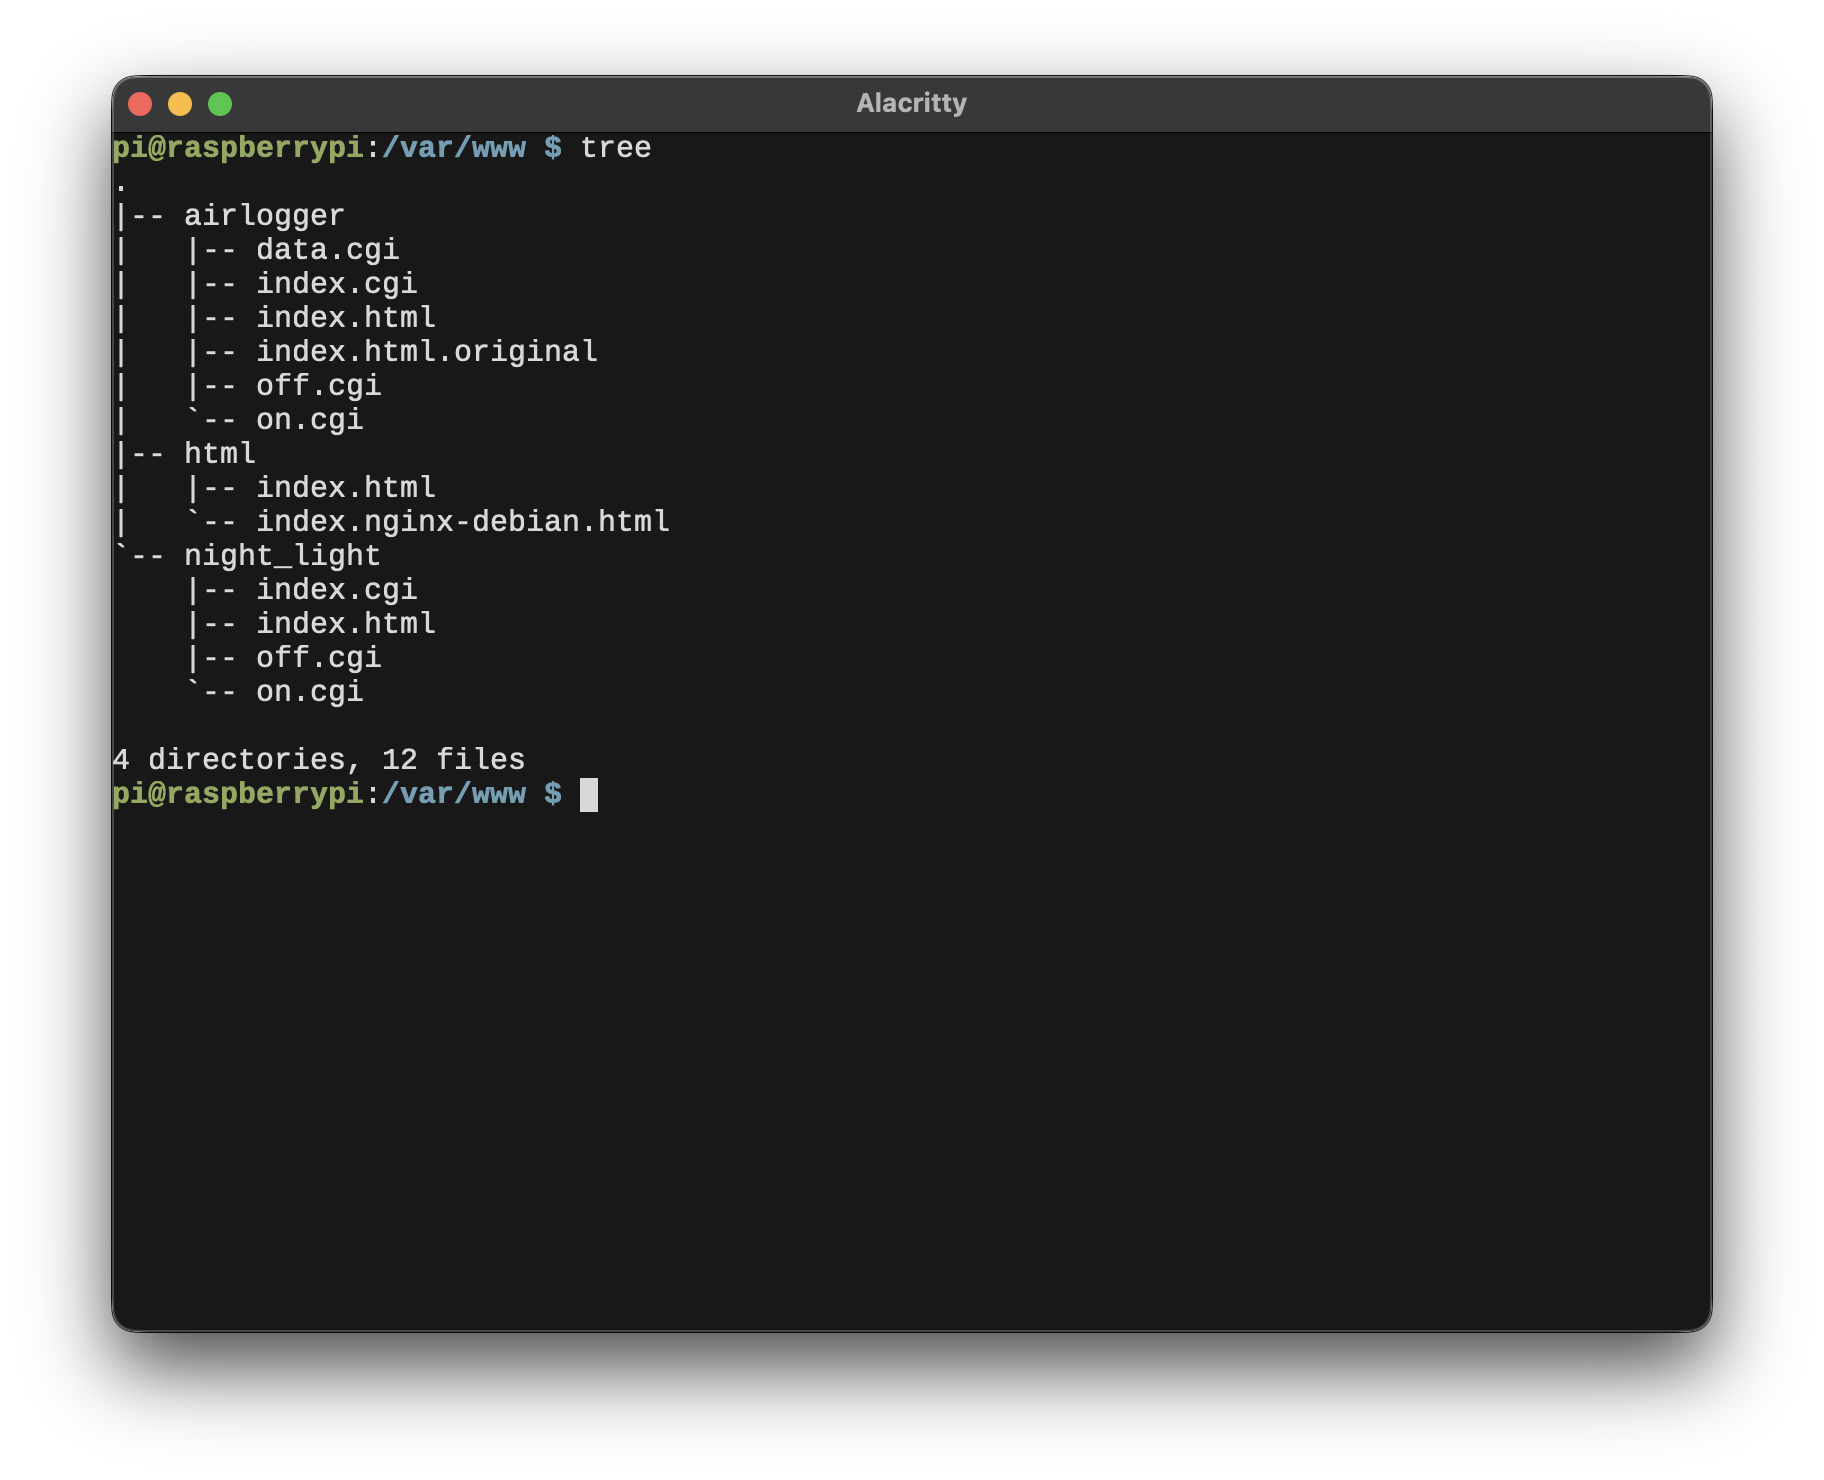
Since I have not yet written my own server, the project currently relies on nginx together with its fastCGI module. This allows me to use simple Bourne Shell scripts to retrieve data from storage and return it to the client as plain text. The approach is straightforward, lightweight, and sufficient for the project’s current requirements.
To avoid the inconvenience of constantly searching for the Raspberry Pi’s IP address, I configured my router to always assign it the same local IP address through a DHCP reservation. This ensures that the web interface is always accessible at a predictable address without requiring any changes to the Raspberry Pi itself.
Convenience
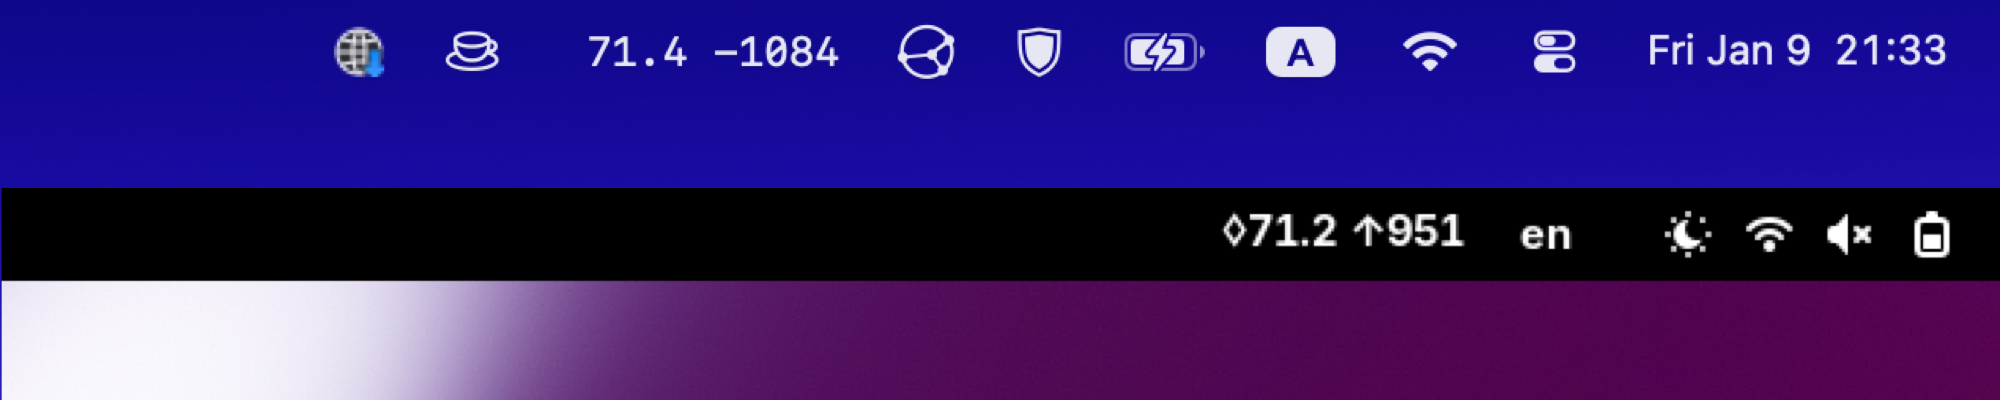
I also display the current temperature and CO₂ concentration directly in the menu bars of both GNOME and macOS, allowing me to monitor the air quality at a glance without opening the web interface.
On Linux, this is accomplished using Executor, a GNOME extension that can periodically execute arbitrary scripts and display their output in the top panel. On macOS, I wrote my own application in Swift using AppKit to provide the same functionality. The application, called CmdBar, periodically executes a command and displays its output in the macOS menu bar, making it easy to monitor any command-line data—not just air quality measurements.
Results
This server has been running reliably and collecting data continuously since March 11, 2024. At the time of writing, it has been operating for almost two years. Its longest uninterrupted uptime—excluding power outages and accidental disconnections—was more than six months.
I have not yet taken the time to perform a comprehensive analysis of the collected data. At the moment, I am unsure how much practical value such an analysis would provide compared to long-term outdoor weather data, since indoor conditions are heavily influenced by factors such as air conditioning, heating, air purifiers, and ventilation. Nevertheless, the data should still yield useful insights. For example, calculating the average indoor CO₂ concentration over the course of a year could help identify long-term trends. If the average CO₂ level increases from one year to the next, it may indicate that changes to the home’s ventilation are needed.
Overall, this project has been an excellent learning experience. It has exposed me to a wide range of topics, including Linux system administration, writing daemons, UNIX signals, making HTTPS requests with curl, parsing JSON, generating charts and PDF reports, designing APIs, and developing both web and desktop applications. More importantly, it demonstrated how these individual components can be combined into a cohesive, practical system.